Predicting the Foursquare rating of Taco Bell restaurants
Introduction
Background
Taco Bell is an American fast food chain which serves Mexican and Tex-Mex foods. According to scrapehero.com, there are currently 7,117 locations in the United States with 824 locations in California. In 2019, there were 7,363 locations worldwide, an increase of 1,467 locations from 5,896 locations in 2010. That is an average increase of 163 locations per year.
Meanwhile, consumers are often guided by where they eat based on the ratings of the restaurants they go to. Thus, having a location with a higher rating is lucrative.
In other words, when opening a new Taco Bell restaurant, the owner might be interested in opening the restaurant at a location that is biased towards a higher rating.
Problem
How does a Taco Bell restaurant’s location affect its rating? In this project, our goal is to determine whether or not a restaurant’s location has an impact on its Foursquare venue rating and if so give the relationship.Interest
This problem is clearly of interest to entrepreneurs looking to invest in a new Taco Bell. However, the methods in this project can easily extend to other franchises, in which case the problem would be of interest to any potential franchise owner.Data
Data Source
We will be using Foursquare API which provides rich information on venues in a specific location and details on each venue. See here for all the response fields.The columns we collect are the Foursquare ID (used to pull the rating), restaurant name, latitude, longitude, city, and Foursquare rating.
For this particular project, we gather entries for Taco Bell locations surrounding three areas, Los Angeles (34.0522°N, 118.2437°W), Orange County (33.7175°N, 117.8311°W), and the midpoint between the two (33.8849°N, 118.0374°W).
Data Cleaning
Because we’re interested in predicting the ratings, we drop locations which do not have a rating from the dataset.We also only keep locations whose name is strictly “Taco Bell.” Explicitly, we drop three listings for “Taco Bell/Pizza Hut” and three listings for “Taco Bell/KFC.”
Finally, when combining data from the three locations, we drop the duplicates.
Feature Selection
While there are many location features that exist in practice (e.g., next to freeway, near mall) and can be incorporated with the appropriate queries or additional sources, we keep the scope of this project simple by only taking the geographical coordinates (latitude and longitude) as features.Methodology
Exploratory Analysis
After cleaning the datasets, the three areas have 44, 45, and 49 locations, respectively. Although the separate datasets have various locations in common, it is still reasonable to plot and compare their distributions (see Figure 1 and Figure 2). |
| Figure 1: boxplot of the ratings for the three areas |
 |
| Figure 2: histogram of the ratings for the three areas |
We can also look at how the ratings are distributed across the map (Figure 3). Locations with ratings less than or equal to 5.8 are shown as red markers while ratings greater than or equal to 6.4 are shown as green markers. The rest use yellow markers (a rating between 5.9 and 6.3). The cutoffs 5.8 and 6.4 were determined by taking the 33rd and 66th percentile of all the ratings, respectively.
 |
| Figure 3: Map show restaurants with low ratings (red), medium ratings (yellow) and high ratings (green). |
At a glance, the map and color-coded ratings suggest that there is a correlation between location and rating.
Predictive Modeling
Given the map and problem, the primary model to implement is a k-nearest neighbors regression.Because we’re using geographical coordinates we set the metric to haversine. We then use the training set to search for an optimal value of k (the number of nearest neighbors) where we perform validation via leave one out. Leave one out works best for the k-nearest neighbors regression, because using other forms of cross validation is prone to leaving holes in the map and results in very poor prediction.
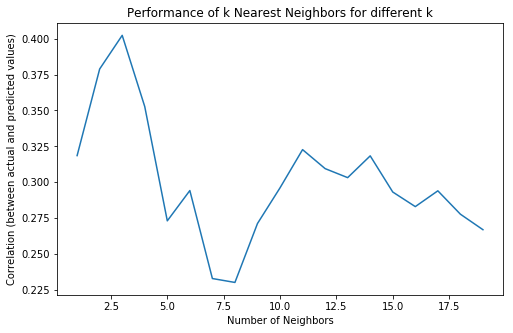 |
| Figure 4 |
As one can see from Figure 4, the optimal value of k occurs at k=3. Note, however, that this value is unstable and may change with a different split (more explicitly, k=2 may show as an optimal value of k for a different random split of the training and test set).
With the value of k=3, we apply the model to the training set and look at it’s performance on the test set. To calculate performance, we first perform a linear regression on the actual and predicted values on the training set. We obtain that
predicted_rating ~ 0.517*actual_rating + 2.927,with a correlation coefficient r=0.7557. We use this regression to transform the predicted values towards the actual values. In other words, we have the transformation
T(predicted_rating) = (predicted_rating - 2.927)/0.517.In short, we define an adjusted predicted rating as the application of the transformation to the output of the k nearest neighbor regression.
Results
The adjusted predicted rating, which in the previous section was defined as a linear transformation T applied to the output of the k nearest neighbor regression, has a mean squared error of 0.2927 (average squared error on the training data). Similarly, the adjusted predicted rating has a mean square prediction error of 0.0882 (average squared error on the test data). In Figure 5, the adjusted predicted ratings are plotted against their respective actual ratings. |
| Figure 5 |
For reference, predicting the average rating (across the training data) has a mean squared error of 0.3260 and a mean squared predicted error of 0.0632.
Discussion
We have shown in this project that there is a correlation between the geographical location of a Taco Bell and its Foursquare rating. However, this leaves many questions such as “Why is this the case?” and “What geographical features can be added that would potentially improve the model or reveal its shortcomings?” Perhaps there exist confounding factors such as users in a particular area have particular behavior when it comes to rating restaurants.It should also be noted that during the modeling process, it was clear that additional data would be advantageous with respect to validation and testing. Furthermore, if not pressed for time and/or the ability to make more premium API calls, one can gather both data for more Taco Bell locations and data for other restaurants and other franchises.
Comments
Post a Comment